|
ComPair Data launches
BlueWater Reporting Application Server
ComPair Data has vastly expanded the range of tools available to its
users
with the launch of a new application server,
BlueWater Reporting.
The new tools include, most notably, the ability to instantly
generate online reports in HTML format, enabling subscribers to quickly
access capacity levels on virtually every global trade lane.
The data can still be downloaded into spreadsheet form, but the new
upgrade allows for critical industry information to be viewable in a
broader range of formats
and on mobile devices.
Aside from improvements from an ease of use perspective, the new
system also houses a host of new functionalities, including:
-
Vessel Deployment Report:
Provides the ability to compare a shipping line’s vessel deployment
patterns on specific trades at regular intervals over the past three
years. This new function can also be used to compare different
lines’ deployment patterns on various trades against one another. As
an example, a user could see how APL’s vessel deployment on the
Asia-to-Oceania trade has varied monthly over the last three years,
and then compare that to one of APL’s alliance partners, or to
another lines outside its alliance.
-
Trade Route Splits Report:
Gives a breakdown of a line’s allocated capacity by trade route on a
specific date. Users can see which trades are most important to a
specific line by seeing what percentage of its global allocated
capacity is dedicated to certain routes. For instance, as of Feb. 5,
56 percent of the weekly allocated capacity provided by Hanjin
Shipping on vessels it operates was tied to the transpacific trade
(including 46 percent on the Asia-North America West Coast two-way
trade).
-
Transit Analysis Report:
Allows a user to quickly view the characteristics of all of the
services provided by all carriers between two ports, most
importantly the advertised transit times of the various services.
So, for example, a user to could see how many services connect
Ningbo and Oakland, which carriers or alliances are operating those
services, and then compare the transit times between the two ports
among the services offered. The report also includes direct links to
the carriers’ schedules for the corresponding services. In this
example, ComPair Data shows four services linking those two ports,
as of Feb. 5, with transit times ranging from 15 days on China
Shipping’s AAC service to 22 days on the Grand Alliance’s CCX
service.
Reports from the new system can be generated on an alliance-wide or
single operator-only basis, or users can select their own subset of
carriers to compare. Previous functionalities, including the core
reports on deployed vessel capacity and allocated capacity by trade
lane, are still available as well
|
|
Schedule Integration
In addition to
providing detailed data for analysis of liner shipping, ComPair
Data also gathers detailed vessel voyage schedule information on
liner services on a global basis.
ComPair takes a
unique approach in gathering schedule data. When
we launch a trade route, we cover 100% of the liner services
available on that trade route.
Schedules are
provided in a data format designed to be easily integrated with contract and allocation data enabling
companies to more
effectively manage and control the procurement of ocean carriers
services.
Click here to
request a demonstration. |
|
|
Data Snapshot- February 12, 2012
Capacity in Eastbound Transpacific nears that
of May 2010
While transpacific carriers stripped a significant amount of
capacity out of the eastbound trade in the last three quarters
of 2011, they’ve held capacity levels stable since the start of
December.
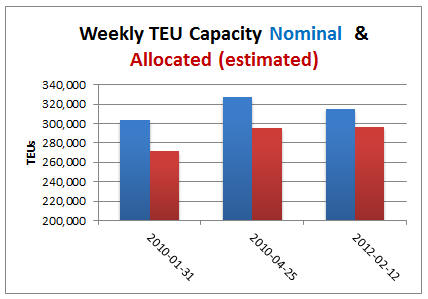
On Dec. 4, carriers were allocating an estimated 295,655 TEUs of
weekly capacity. On Feb. 12, weekly capacity had risen
marginally to 296,177 TEUs (an increase of 0.1 percent).
Nominal capacity on the trade has hardly wavered in the last 10
weeks either, moving in a band of 314,812 TEUs (the Feb. 12
level) and 319,793 TEUs (on Jan. 1). On Dec. 4, it was 314,880
TEUs, virtually the same level on February 12 .
Looking back to 2010 when rates rose significantly, allocated
capacity is roughly 9 percent higher today than it was in early
February 2010 (272,157 TEUs), when carriers had pulled sizable
swathes of services in an attempt to better balance supply and
demand on global east-west trades. However, on February 12 it
was at virtually the same level as it was at the beginning of
May 2010, at the end of transpacific service contract
negotiations that year.
|
|